Analytics
The Analytics page is your metric dashboard: how much packaging you place on the market, what it is estimated to cost, and how that is trending - all computed from your imported data joined live to the regulatory brain's cited rates. Honesty statuses ride along everywhere, so you always know how firm each figure is.
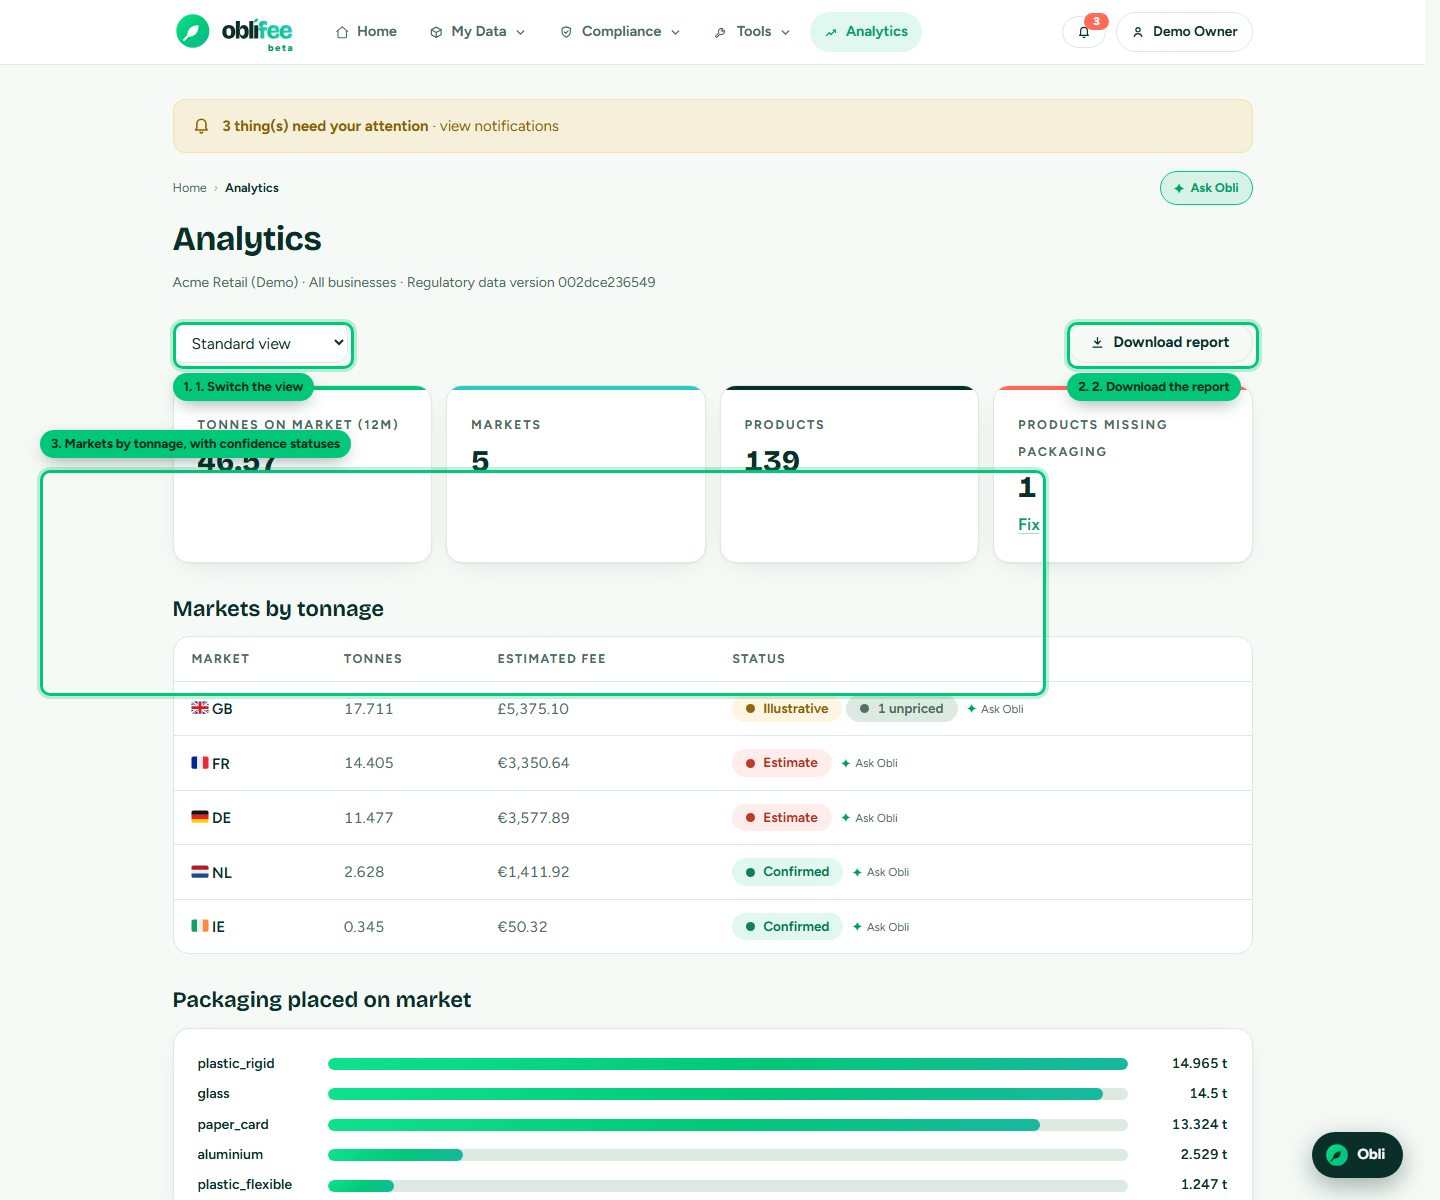
What it shows
| Section | What it tells you |
|---|---|
| Health banner | Whether anything needs attention - shipped products missing packaging, missing rates, non-confirmed figures, obligations due soon or imports still running. |
| KPI cards | Tonnes on market (12 months), number of markets, number of products, and products still missing packaging. |
| Markets by tonnage | Each market with its tonnage, estimated fee and confidence status, worst-case first. |
| Packaging split | The materials you place on the market, by tonnage. |
| 12-month trend | Monthly (or, on narrow screens, quarterly) tonnage over the last year. |
Every figure carries a confidence label - confirmed, illustrative or estimate - and traces back to its source. See Confidence & citations.
:::note Scoped to your active business Analytics respects the business picker in the header. Pick a single business to narrow every figure to it, or leave it on all businesses for the cumulative position. :::
The view dropdown
The view control (top-left) reshapes the dashboard for different readers. Your data does not change - only what is emphasised:
| View | Adds |
|---|---|
| Standard | The core KPIs, markets, split and trend. |
| CEO | Annualised fee totals per currency, a certainty split, a run-rate forecast and identified savings. |
| CFO | The same financial totals plus upcoming obligation deadlines. |
| Supply | Top products by packaging weight and your connected data sources. |
| Product | Top products and the savings identified per product by the Packaging Builder. |
Everything in these views is derived from data the platform already holds - no model is involved, and statuses ride along.
The download-report control
The button on the top-right exports a submission-ready PDF report of everything on the page, in Oblifee's brand. It is the fastest way to hand your position to a scheme, an advisor or a colleague. See Reports for what it contains and when to use it.
:::tip Ask Obli about a number Every market row has an Ask Obli button that opens the assistant with a question about that market already typed in. See Obli. :::
Where to go next
- Reports - the submission-ready PDF and what is in it.
- Packaging Builder - turn a costly line into a cheaper concept.
- Confidence & citations - what the status labels mean.