Reading your EPR position
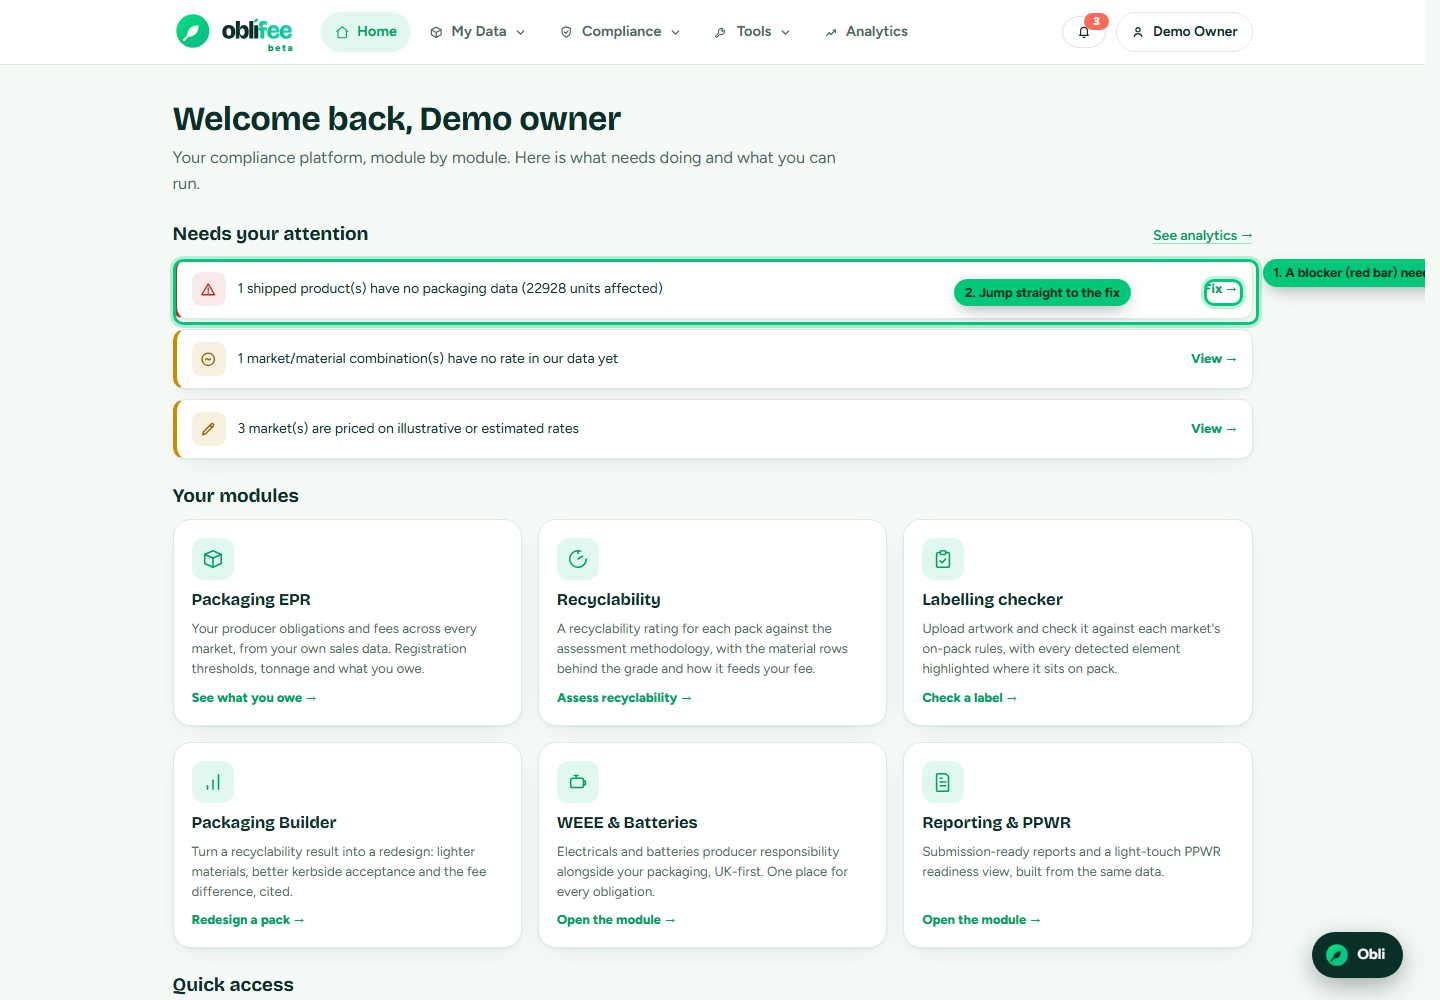
Your EPR position lives in two places that read the same data: the home board
(/portal), which surfaces what needs attention, and the Analytics dashboard
(/portal/analytics), which shows the full metric picture. This page explains how
to read both.
The health signal
Everything rolls up to a single health colour, computed from the alerts on your data:
| Health | Meaning |
|---|---|
| 🔴 Red | At least one blocker - a gap that materially affects your position. |
| 🟠 Amber | One or more warnings - worth attention, but nothing is blocking. |
| 🟢 Green | All clear - no open alerts. |
On the home board this shows as the Needs attention list (or an "all clear" banner); on Analytics it shows as a banner you can open to see every alert.
Headline figures
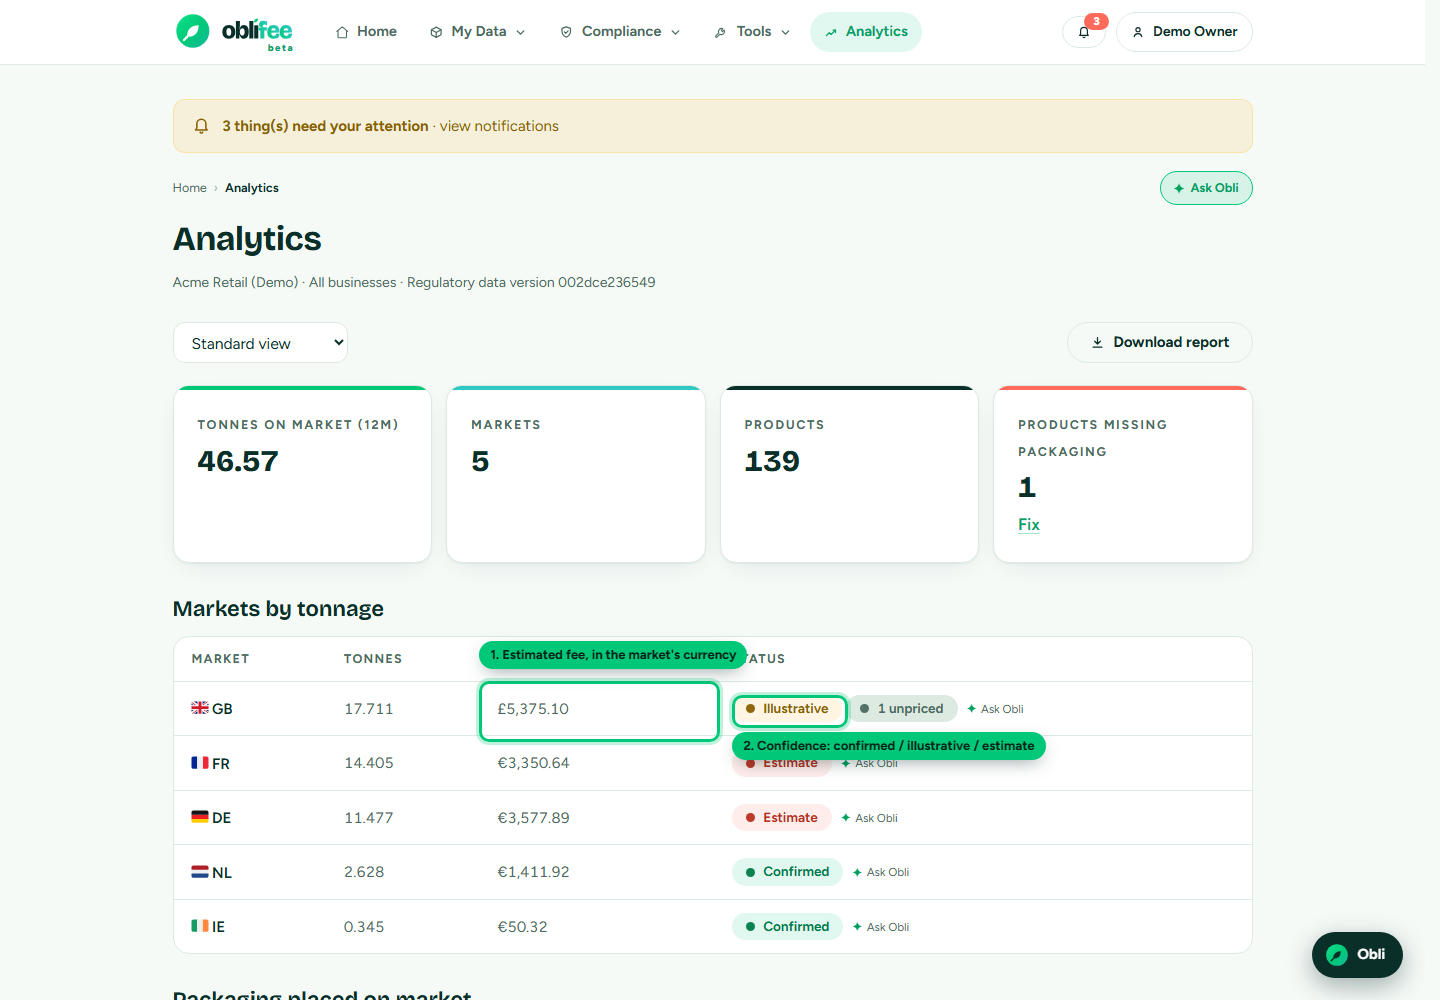
The Analytics dashboard leads with four KPI cards, each computed over the last 12 months of data for the businesses currently in scope:
| KPI | What it counts |
|---|---|
| Tonnes | Total packaging tonnage placed on the market (unit weight × volume). |
| Markets | How many distinct markets you have volume in. |
| Products | Products in your workspace. |
| Unmapped | Products that have shipped but still lack packaging data. |
If Unmapped is above zero the card turns coral and offers a direct link to fix it. Below the KPIs sit the per-market breakdown, the material split and the 12-month trend.
Per-market breakdown
The Markets by tonnage table has one row per market, ordered by tonnage:
- Market - the nation, with its flag and code.
- Tonnes - packaging tonnage on that market.
- Est. fee - the estimated fee in that market's currency (a dash if no rate is priced yet).
- Status - a pill showing the market's worst confidence: estimate, illustrative or confirmed. A neutral "n rates missing" pill appears when the brain holds no rate for some material you use there.
Ask Obli to explain any market straight from its row.
Material split and trend
- Packaging split shows tonnage by material, as a set of bars.
- 12-month trend charts tonnage per month (per quarter on narrow screens).
Role views
A view picker switches the dashboard between standard, CEO, CFO, supply and product lenses - adding, for example, annualised fee totals and a certainty split (CFO/CEO), identified savings (product), or top products by packaging weight (supply/product). The underlying figures are the same; the view only changes which aggregates are shown.
Alerts and next actions
Alerts are the heart of the position - each is a specific, actionable state:
| Alert | Severity | What it means | The fix |
|---|---|---|---|
| Shipped without packaging | Blocker | Products have volume but no packaging components, so their tonnage cannot be priced. | Add packaging to those products. |
| Rates missing | Warning | You use a material in a market the brain holds no rate for. | Informational - review the market. |
| Non-confirmed figures | Warning | A market's fee rests on estimate or illustrative rates. | Review the market's rates. |
| Obligation due soon | Warning | A registration, report or payment falls due within 45 days. | Open your obligations. |
| Imports pending | Warning | An import job has not finished. | Review your imports. |
The shipped without packaging blocker links to your products, pre-filtered to exactly the products that have shipped and still lack packaging, so you can close the gap in one place.
:::note Your read/ignore choices stick Marking an alert read or ignored is remembered. An alert only disappears when the underlying condition genuinely clears - it never vanishes just because the page was recomputed. :::
Downloading your position
From the Analytics dashboard, Download report produces a PDF of your current position, scoped to the business you have selected. (Report export is not available on a trial plan.)
Where to go next
- Fees & eco-modulation - how each fee in the table is calculated.
- Nation by nation - the obligations behind the "due soon" alert.
- Recyclability (RAM) - why some UK fees are modulated up or down.